The salient features of alternatives

In the wake of the Global Financial Crisis, with record low interest rates and highly volatile equities, the term ‘alternatives’ became increasingly flexed.

In this perspective, what are the common denominators (if any) for alternative products?

Semanthic approach

« Alternatives » comes from the Latin word « Alternatum », derived from « alter », meaning « other ».

A priori, alternative investment assets are those which do not fall into the « traditional » asset classes e.g. cash, stocks, bonds that retail investors are most familiar with. Thus, alternatives are supposedly « exclusive » products designed to meet the specific needs of a miority of investors e.g. institutions, wealthy individuals.

In this respect, no need to wonder why so many « liquidative alternative » funds use the following marketing pitches like « Our fund incorporates the best of both worlds: Hedge fund like strategies and return potentials without the high fees and loss of liquidity ».

Being « alternative » does not necessarily mean being exclusive. It can merely mean being different (or pretending to be different), and quite unsurprisingly perform poorly.

Alternative products traditionnally fall in the following categories:

  • Hedge funds
  • Private equity buyouts
  • Venture capital
  • Other types: private equity real estate, private debt, private equity infrastructure, growth equity funds

Approach in terms of investment characteristics

4

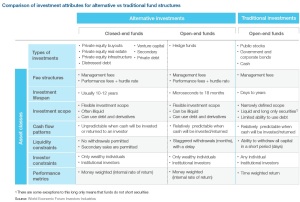
Investment structure

Regulatory framework

The legal structures used by alternative investment funds differ significantly from most traditional fund arrangements e.g. mutual funds in the US, unit trusts in the United Kingdom, and UCITS funds in Europe.

En Europe, by the term « alternative funds » is meant all investment funds that are not already covered by the European Directive on Undertakings for collective investment in transferable securities (UCITS). This includes hedge funds, funds of hedge funds, venture capital and private equity funds and real estate funds.

The legal structure that alternative investment funds use is more flexible relative to traditional funds. They are not constrained by legal barriers imposed on traditional funds that limit their ability to use debt (leverage), short sell securities, invest in illiquid securities, or use derivatives when seeking to implement their investment strategies.

Investment lifespan

  • Most alternative products use closed-end fund structures with a fixed lifespan (typically 10-15 years). All of the value of the investment is returned to investors within this timeframe, who must then identify new investment opportunities to reinvest the capital in.
  • Hedge funds are an exception: they usually offer open ended funds in that the capital is automatically reinvested with the fund unless the investor requests that the capital be returned to them.

Cash flow patterns

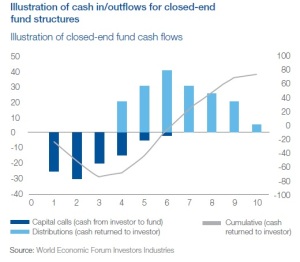
  • Alternative investments have more unpredictability in the size and timing of cash flows than that of traditional funds. Whereas cash invested in a traditional fund is usually fully invested within one business day, most alternative investment funds accept cash commitments from investors (no cash is transferred to the fund until it needs the cash to make an investment). The cash will be invested (« capital call« ) over a period of time (often years).
  • The return of capital (a “distribution”) to an investor is unpredictable, since fund managers cannot predict the timing or price of an asset in advance. The resulting cash flow pattern is known as a j-curve, which is illustrated below.

5

Liquidity constraints

Most alternative products use closed-end fund structures that do not permit investors to withdraw their capital from the fund due to the illiquid nature of the investments. However, investors can sell their stake to a secondary fund, which specializes in such transactions.

Fee structures

Most alternative investment funds have two primary fees: management fees and performance fees.

  • Management fee: Fund managers usually receive fees of 1-2% of raised or invested capital per annum. Such fees are intended to cover the costs of operating the fund. Fees in excess of these costs are retained by the firm that manages the fund, which can create an incentive to raise large funds.
  • Performance fees (also known as carry): Fund managers typically receive 20% of net profits generated by the fund over its lifespan, once the hurdle rate (discussed below) has been met. Sharing in the profits serves to align the interests of the fund manager and the underlying investor.
  • Hurdle rate (also known as a high watermark or preferred rate of return): Most fund agreements stipulate a hurdle rate of 7-8%. Fund managers do not receive performance fees until they meet the hurdle rate. As the hurdle rate is calculated over the whole life of a fund, sub-par returns in one year need to be matched with outsized returns in following years. This incentivizes fund managers to aim for high absolute returns and take a long-term view.

Performance metrics

Alternative investors use different performance metrics than those used by traditional funds. The difference reflects the fact that the former have control over the timing of an investment, but traditional managers do not (the investor determines this).

  • Traditional funds measure returns using the time weighted method, which ignores how much cash was invested and simply computes returns based on the value of a security at two points in time.
  • Alternative investors use the money weighted return method (aka internal rate of return, IRR), which weights returns based on the size of the cash inflows and outflows over time. In turn, alternative investment funds are typically measured by the rate of return they are able to generate over a period of time and a cash flow multiple, which compares how much cash was returned to an investor relative to how much they started with.

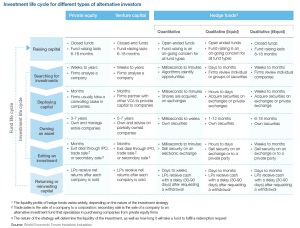
Investment life cycle

The investment life cycle for most types of alternative investments is usually much longer and involved than that of a traditional investment. The steps and the order they are taken in are shared by all alternative investments, but there is tremendous variance between how each asset class executes each step and how long each step can take.

6

A common role in society and the economy?

Capital markets

  • efficient allocation of capital to long-term, illiquid or risky investment assets that might otherwise be underfunded by traditional investors.
  • The trading volume of hedge funds strengthens price discovery and reduces bid-ask spreads (transaction costs). They do this by serving as counterparties willing to buy or sell assets that might otherwise have remained illiquid.

Real economy

  • Economic impact: innovation, competition
  • Corporate gouvernance:  many alternative investors have a positive effect on corporate governance e.g. activist hedge funds. This view would need to be nuanced, though.

Shadow lending

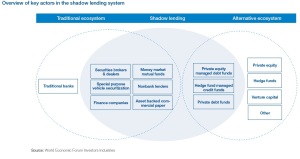
Over the last few years, an increasing number of firms expanded into providing debt to businesses, an area traditionally dominated by banks. (cf article: Private Placements: not so « private » any more… »). This disintermediation process is part of shadow banking /shadow lending.

7

Sources:

World Economic Forum – Alternative Investments 2020: An Introduction to Alternative Investments

PWC – Alternative Asset Management 2020

BlackRock, 10 Myths surrounding alternative investments
 

If ESG enhances corporate financial performance, where is the ESG alpha in SRI portfolios?

Many of the questions surrounding the inclusion of environment, social and governance (« ESG ») considerations in financial analysis deal with the same issue: does ESG hurt performance? Do SRI investors have to pay more to align their investments with their values?
According to the neoclassical understanding of financial markets  (Markowitz 1952; Fama 1970; Friedman 1970; Fama 1991), the ESG–CFP relation is, at best, neutral. Neoclassical economists usually refer to the the shareholder theory, stating that the only social responsibility of business is to increase profits, and that doing otherwise will reduce shareholder value (Friedman, 1962).

Since the 1970s, more than 2000 empirical studies have been published on the relation between corporate financial performance (« CFP ») and ESG criteria. In this post, I want to spare my brave readers the exhaustive list of the studies /scholars.

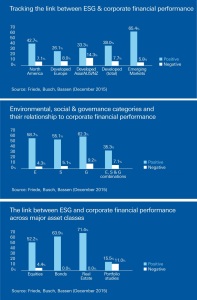
Gunnar Friede, Timo Busch & Alexander Bassen (2015) collected the findings of about 2200 individual studies over the last 40 years. The results show that there that there is a solid emprirical basis for believing that: 1) there is a nonnegative ESG–CFP relation; 2) this relation  highlights the positive ESG impact on CFP; 3) this impact is stable over time.

1

Their main conclusion is the following:

« the orientation toward longterm responsible investing should be important for all kinds of rational investors in order to fulfill their fiduciary duties and may better align investors’ interests with the broader objectives of society. This requires a detailed and profound understanding of how to integrate ESG criteria into investment processes in order to harvest the full potential of value-enhancing ESG factors. A key area for future research is to better understand the interaction of different ESG criteria in portfolios and the relevance of specific ESG sub-criteria for CFP. These insights will shed further light on the ESG determinants for long-term positive performance impacts. »

Indeed, the three scholars find a significant difference in correlation levels of portfolio and nonportfolio studies. Studies with neutral or mixed findings increase proportionately in portfolio-based studies and constitute nearly three quarters. ESG/SRI portfolios exhibit lower correlations to CFP and less positive findings.

Why do portfoliostudies exhibit less promising results than nonportfolio studies? Is there any ESG alpha for ESG mutual funds?

For virtual portfolios and financial products such as mutual funds or indices, the potential ESG alpha can be covered for 3 main reasons:

  1. Overlapping effects of systematic andidiosyncratic risks (Campbell et al. 2001; Luo and Bhattacharya 2009)
  2. Most ESG funds constitute a mixture of negative and positive ESG-screened funds, which could result in distortion and cancellation of any remaining effects (Derwall, Koedijk, and Ter Horst 2011). We can note that The European SRI approach generally uses positive criteria (security selections based on the most socially responsible companies), whereas the American approach was more oriented towards negative screening.
  3. Transaction costs (market impact, brokerage fees) reduce the potential ESG alpha of mutual funds (Carhart 1997; Khorana, Servaes, and Tufano 2009) in comparison with nonportfolio studies.

Even looking at SRI indices, which eleminate factors such as transaction costs and management skills, is far from being a panacea, since SRI indices are acknowledged to have a style bias (growth) relative to traditional indices (Statman and Klimek, 2005). For these reasons (and many others), the findings to date from empirical portfolio studies are contradictory, and there is no doubt financial literature will bring about fruitful discussions on this matter.


Sources:

Ussif.org

Deutsche Bank

Gunnar Friede, Timo Busch & Alexander Bassen (2015) ESG and financial performance: aggregated evidence from more than 2000 empirical studies, Journal of Sustainable Finance & Investment, 5:4, 210-233

Swing Pricing: swinging between anti-dilution and marketing

The idea behind Swing Pricing is to protect remaining investors from dilution caused by trading costs resulting from a sizeable net flow of subscriptions and redemptions within the fund.

How is determined the price of a share of a mutual fund?

Net asset value (NAV) represents the market value of the share of a fund. This is the price at which investors buy (« bid price ») fund shares from a fund company and sell them (« redemption price ») to a fund company.

Calculation of the NAV: Current markte value of the fund’s net assets (value of secuties + cash – liabilities of a portfolio) divided by the number of shares outstanding

–> if a fund has total net assets of $100 million and there are one million shares of the fund, then the NAV is $100 per share. (Fund liabilities include items such as fees owed to investment managers.)

The calculation of the NAV is undertaken once at the end of each trading day based on the closing market prices of the portfolio’s securities. Unlike ETFs, the price of open-ended mutual funds do not adjust continuously to supply/demand.

When a fund pays investors the required distribution, its NAV is reduced by the amount of the distribution. Hence, a mutual fund’s NAV is not a good indicator of a fund’s performance.

How is dilution of the NAV caused?

Sizeable subscriptions and redemptions are not painless for those who are already invested in a fund. The portfolio manager may need to purchase and/or sell the underlying investments in his portfolio to accommodate such requests by investors. The purchase and sale of the underlying investments incur trading costs and related expenses including transaction charges, brokerage fees, taxes and bid/offer spreads, which will be charged to the fund and therefore diluting its NAV. All investors in the fund pay for those who cause these extra trading costs/expenses.
Protecting investors from dilution: dilution levy and swing pricing

– Anti-dilution levy/adjustment: AM companies can charge a dilution levy/adjustment on large investors joining or leaving a fund. The amount of any such dilution levy/adjustment is calculated by reference to the estimated costs of dealing in the underlying investments. This dilution levy/adjustment on a is paid into the fund.
Dilution adjustment affects everyone who deals on a particular day when there are large investors joining/leaving the fund, whereas Dilution levy only affects the individuals who trigger the price movement.

– Swing pricing: the fund unit price is adjusted for large net subscriptions or redemptions. Thanks to this procedure, transaction costs are only borne by those who cause them.

Why is swing pricing being massively introduced?

dilution1

Swing Pricing is currently being introduced/already in place for the funds which mainly invest in asset classes which typically face significant liquidity issues (emerging market bonds/ HY bonds, …).

Swing pricing: how does it work?

There are two standard methods for implementing swing pricing:
Full swing: the NAV is always adjusted if there is a subscription or redemption. The direction of the swing is determined by the net capital flows of the day.
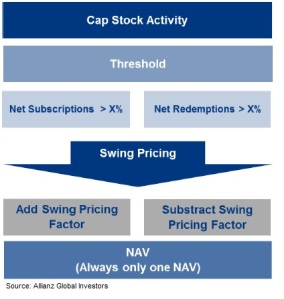
Partial swing: the NAV is only adjusted when the net capital activity of the day exceeds a predefined threshold. The Swing Pricing Threshold is the level of net capital activity (expressed as a % of the NAV or an absolutely monetary value, or both) required to trigger the swinging process. It is determined by the investment teams of the AM company . E.g. 3% of net volume of subscriptions and redemptions in normal markets, and 1.5% in distressed markets.

–> Partial swing is the most commonly applied swing pricing methold employed in Luxembourg-domiciled funds

The amount with which the NAV is adjusted is called the Swing Pricing Factor. It is supposed to cover for the trading costs incurred due to in- an outflows. The Sing Pricing Factor is applied as a result of capital activity exceeding a pre-defined threshold (for partial swing) or any capital activity (for full swing). It is determined by the investment teams of the AM company and gets higher in case of distressed markets (e.g. 0.5% in normal markets, and 1% in distressed financial conditions).

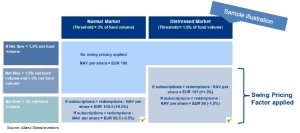
Exemple of Partial swing:

dilution2

Exemple: NAV per share of EUR 100. Threshold: 3% of fund volume in normal markets ; 1.5% of fund volume in distressed markets.

dilution3

Advantages and limits of Swing Pricing

Advantages

– Cost effective anti-dilution technique for single-priced funds

– Can deter frequent trading activity

– Clever from a marketing point of view, since this technique is less « aggressive » than front-end loads/redemption fees.

Limits

– As swing pricing is applied on capital activity at the level of the fund, it does not address the specific circumstances of each individual investor transaction.

– Increases the volatility of the NAV (whose evolution was traditionnally seen by many investors as a performance indicator)

– In case Swing Pricing Thresholds are discovered by some investors, it may favour market timing strategies


Sources:

Swing Pricing Guidelines, alfi, December 2015

Le swing pricing est un mécanisme inhabituel, Agefi

Playing with swing pricing, tough choices for US fund managers, FinOps Report

Private Placements: not so « private » any more…

“Half a decade into the financial and economic crisis, growth remains sluggish and banking sector problems are still inhibiting a more strongly footed recovery in OECD economies from taking hold. As banks are deleveraging, capital markets will have to play a bigger role especially in financing long-term investment, including in infrastructure, SMEs and knowledge-based capital, which are key contributors to economic growth and job creation.8 SME finance, like SMEs themselves, is exceptionally diverse and complex and faces unique challenges. As such, it was unanimously agreed that no “silver bullet” exists for SME finance and it is only by pushing different ideas, avenues and instruments that we can embrace the different constraints and predicaments. Governments and regulators were called to develop the necessary infrastructure for new financing instruments for SME financing (such as standardised publicly available information, transparent financial reporting, platforms, credit scoring mechanisms, standardised documentation) as well as alleviate some of the regulatory burden associated with instruments such as securitisation. The importance of educating and empowering SMEs and in particular raising awareness on the financing options available, beyond the advice usually offered by SME’s “relationship” banks, should not be overlooked.” – OECD (2014)

Private Debt is becoming a mainstream option offered to corporates to access long-term debt. In the wake of the 2008 credit crisis, asset managers contributed to bridging the financing gap for SME sector. Institutional investors increasingly perceive private debt as an asset class that can provide strong risk-adjusted returns  in a low-interest rate environment.

Private placements?

There is no formalized definition. A private placement (PP) involves a placement of debt (in the forms or bonds or notes) with a small group of selected investors, often non-banking institutions.

Private debt financing accounts for c. 6% of the total estimated funding for SMEs.

  • AUM of private debt funds: USD 523bn as of June 2015 (up from USD 483bn as at end of 2014)
  • 2015: USD 18.8bn of capital raised by Europe-focused direct lending funds closed in 2015 ; 120 private debt funds closed

Context: the 2008 credit crisis, a game changer

–  The crisis ravaged banks’ balance sheets. New regulations (Capital Requirements Directive IV under Basel III) forced banks to reduce their loan books (this process is still ongoing).

– As the economy was recovering, SME demanded fresh capital to refinance their existing loans and fund their business growth

– Asset managers took advantage of this situation to offer debt financing solutions backed by their clients

Private Placement markets

US

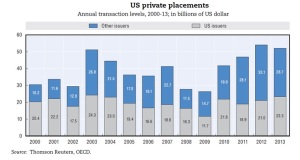
The US private placement market, which is available to both US and non-US companies, is already well developed (c. 80% of the corporate debt is financed by financial markets in the US vs c. 25% in Europe). Documentation standardisation was seen as one of the enabling factors in the US PP market, which benefits from standard loan documentation (Model Note Purchase Agreement) and covenants.

pp1

Europe

France: Euro PP

Euro PP Charter, which was drafted by the Euro PP working group composed by several professional organizations under the auspice of Banque de France, French Treasury and the Paris IDF Chamber of Commerce and Industry, is designed to facilitate financing for intermediate-size enterprises (ISE) and SMEs, whether listed or not. The first Euro PP loan was issued by Bonduelle in 2012 (EUR 145m ticket). The Euro PP was inspired by its German cousin, the successfulSchuldschein market.

In France, private debt funds cannot make loans to borrowers incorporated in France (or French branches of foreign companies) and private debt lending must take the form of a bond instrument.

From a technical point of view, a Euro PP loan can be issued in two ways:

  • book-building method: the arranging bank proposes a price range and builds an order book. The final price is communicated to the market
  • competitive biding method : the arranging bank issues a call for tenders from potential investors.

Germany : the Schuldschein sector

The German Schuldschein sector is twice the size of the French market (it was far longer established) and is a key part of the country’s midsized business sector. Schuldschein loans were traditionally issued by German companies. However the market has recently attracted international borrowers. The majority of investors in this market are still German banks and insurance companies but European banks are teaming up with German banks to arrange Schudlschein for borrowers in their jurisdiction.

Schuldschein issuance is invariably in the form of a private and unlisted bilateral loan agreement.

Main limits in Europe:

– Under-developed investor base

– Lack of standardisation documentation increases the issuing costs (advisory, legal fees and other), as individual agreements need to be drafted for each transaction.

Banks vs alternative credit providers

– Competitive threat to commercial banks from the variety of alternative credit providers

– However, commercial banks and private debt managers are usually working together to structure transactions (e.g. via a unitranche arrangement, by n agreement between lenders). Indeed, these 2 players have different risk appetites (especially given the increased capital requirements for banks).

– PP are more expensive than standard loans

pp2

Serving the financing needs of small and Mid-sized corporates

– Small tickets: privately placed bonds have no minimum size limit.

– Capital markets remain fragmented for SMEs. Cost and reporting requirements associated with bond issuance are obstacles for these companies to access public bond financing (where issuances tend to be > EUR 100M).

– Diversification of their sources of financing

– Rapidity: a private bond issuance takes around 3 month to be finalized in Europe. The level of due diligence is not as extensive as for a high yield bond offering but more extensive than for a loan because the investors will hold the debt for longer.

-SME keep in mind that banks have been reluctant to grant them loans during credit crisis episodes

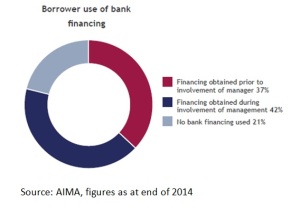
– Stable funding in the mid-term: Almost 35% of the managers surveyed by AIMA provide financing terms of 4 years or more. In the banking model, the liability structure (deposits) is short term in nature, hence bank tend to issue loans with smaller durations.

– Private placements is that they provide a source of funding without the need for a formal credit rating and reporting requirements expected in other capital market debt product

– The direct relationship between lenders and borrowers allows for the development of a closer connection with investors, which is beneficial to smaller companies with limited visibility in the public markets and the wider investor community

Investment merits

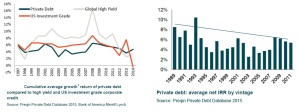
– Track record. The measure used to assess the investment performance of a private debt fund is internal rate of return: the % rate earned on each dollar invested for each period for which it is invested.

pp3

– Superior protections vs traditional bonds: a due diligence process is undertaken before making a loan. The loans have a final maturity date, a contractual return and a tailored set of terms and charge over the assets of the company that protect investors in the loan from the risk of loss in priority to other unsecured investors.

– Appeal vs HY bonds: Volcker rules reduced liquidity in bond markets. High yield bonds became less liquid than before and bond investors may now face a liquidity crunch in the event of a large correction.

– Diversification tool as correlation between historically lowly correlated asset classes increased

– The lack of liquidity and secondary markets is not a critical issue for buy-and-hold long-term investors

Characteristics of Issuers / issuances

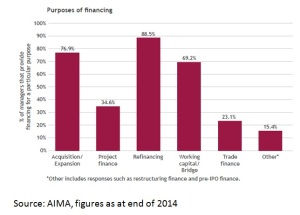
– Purposes of financing : 95% of the managers surveyed provide financing for acquisition/expansion or refinancing purposes

pp4

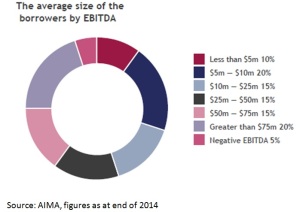
– Managers are generally providing finance to borrowers (who have an EBITDA) of USD 25m or less.

pp5

Investors

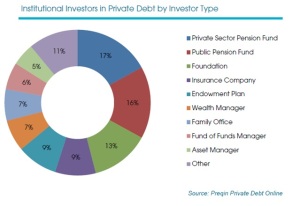
– Investor type: public and private sector pension funds make up the largest proportion of all active investors in private debt

pp7

– Allocation by investor type: family offices allocate c. 11% of their AUM to Private debt strategies, followed by wealth managers (c. 7%), foundations (c. 5%), asset managers and endowment plans (c. 4%), and public and private sector pension funds (c. 3%). Given their AUM, these later investors are an important source of capital for private debt firms.


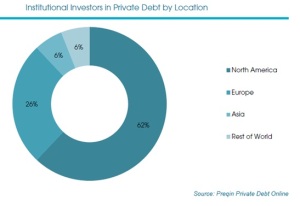
– Geographic distribution: The location of investors within private debt is heavily skewed towards North American and European markets. The US, remains the epicentre of the non-bank lending industry.

pp8


Sources:

Financing the economy – The role of alternative asset managers in the non-bank lending environment – AIMA Research

The Rise of Private Debt as an Institutional Asset Class, ICG

2016 Preqin Global Private Debt Report

Private Debt Markets, GlobalCapital, December 2015

OECD JOURNAL: FINANCIAL MARKET TRENDS – VOLUME 2014/1, OECD 2014

Les investissements sous contraintes des institutionnels français

Les investisseurs institutionnels sont des organismes financiers qui, par leur nature ou leurs statuts, sont tenus de placer une grande partie de ressources qu’ils collectent en instruments financiers.

Leur rôle en tant qu’intermédiaires financiers et leur impact sur les stratégies d’investissement se sont accrus de façon significative au cours des dernières années avec la déréglementation et la mondialisation des marchés financiers.

Ils ont en commun une structure de bilan relativement similaire : un portefeuille diversifié d’actifs (principalement d’actifs financiers négociables), tandis que leur passif se compose d’engagements non négociables (i.e. parts d’OPC, réserves d’assurances, réserves de fonds de pension.)

Typologie des investisseurs institutionnels:

  • Sociétés d’investissement
  • Fonds de pension
  • Fonds souverains
  • Fondations et Fonds de dotation
  • Assureurs

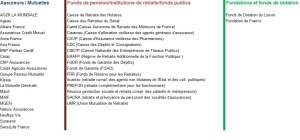
Cartographie des principaux investisseurs institutionnels français:

liste instit

Les investisseurs institutionnels français, dont les assureurs représentent 85 %, gèrent environ EUR 2 500 bn à fin 2014.

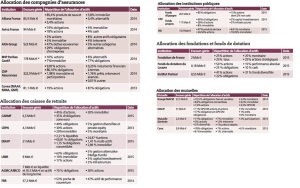
Détail de leurs encours et de leur allocation infra :

annexe

Exemple de portefeuille d’institutionnel: FRR au 31/12/2014

  • D’une part, des mandats indiciels de montant unitaire important, d’autre part des mandats de gestion active concentrés sur des segments de marché délivrant un alpha peristant et adapté au profil d’un investisseur de long terme.
  • « Le FRR privilégie les mandats de gestion comme support d’investissement, ces derniers permettant une totale personnalisation des univers et contraintes d’investissement, du reporting ainsi que des coûts maîtrisés. Le Fonds investit également via des fonds ouverts, notamment pour augmenter la flexibilité de sa gestion. »

frr


Un contexte de taux d’intérêt faibles

  • Depuis la fin des années 70, la baisse quasi continue des taux d’intérêts a permis aux institutionnels qui investissaient dans des emprunts d’Etats ou d’entreprises de bonne qualité d’obtenir chaque année des performances positives et peu volatiles
  • La faiblesse actuelle (et susceptible de s’installer) des taux d’intérêt des dettes souveraines classiques oblige les investisseurs institutionnels à modifier leur allocation d’actifs afin de limiter / contrer la baisse de leurs rendement

Recherche de rendement supplémentaire: modification de l’allocation d’actifs

  • Obligations: qualité de crédit des titres plus faible, allongement de la maturité des titres , élargissement des portefeuilles aux émetteurs hors Eurozone
  • Plus grande pondération de classes d’actifs à moindre liquidité: dette d’infrastructures, immobilier non coté, private equity
  • Renforcement des stratégies ESG : la prise en compte de facteurs extra-financiers  peut représenter à la fois une source de performance et une manière de réduire le risque.

Contraintes réglementaires liées à Solvency II

  • Minimisation de la consommation de fonds propres

L’allocation d’actifs reposait auparavant sur le rendement et le risque. Avec Solvency II s’ajoute la nécessité de minimiser la consommation de fonds propres.

Solvency II impose aux assureurs/mutuelles de satisfaire de nouveaux critères prudentiels. Le niveau de fonds propres des assureurs doit leur permettre de faire face à l’ensemble des risques auxquels ils sont exposés : le risque assurantiel, le risque opérationnel, le risque de contrepartie et le risque de marché.

L’ensemble de ces risques est mesuré par le SCR (Solvency Capital Requirement), correspondant à « l’agrégation » des SCR souscription, SCR opérationnel, SCR contrepartie et SCR marché (le SCR marché comporte lui-même différentes composantes, selon le type de placements des organismes : risque sur les actions, sur l’immobilier, sur les obligations, etc.).

Le SCR (Solvency Capital Requirement) est calibré pour correspondre aux fonds propres nécessaires à l’assureur pour faire face à ses engagements à un horizon 1 an avec un seuil de confiance de 99,5% (soit une probabilité de ruine susceptible de se produire environ une fois tous les deux cents ans.)

Conséquences: augmentation du coût en capital de la détention d’actifs risqués tels que les actions.

Focus sur le SCR de marché :

Le besoin en capital du module marché est calculé à partir de 6 sous-modules correspondants aux facteurs de risque de marché identifiés par le CEIOPS (Committee of European Insurance and Occupational Pensions Supervisors) :

Taux : quantifier le besoin en capital nécessaire pour faire face à l’impact d’une évolution de la structure de la courbe des taux (à la hausse ou la baisse) sur la valeur du bilan.
Actions : quantifier l’impact de la baisse des marchés actions sur la valeur du bilan.
Immobilier : quantifier l’impact de la baisse des marchés immobiliers sur la valeur des actifs.
Crédit : quantifier le besoin en capital correspondant au risque d’une évolution à la hausse (ou à la baisse pour le CDS) des spreads de crédit (écart entre le taux actuariel d’un produit de taux et le taux sans risque de la devise du titre).
Concentration : quantifier le besoin en capital correspondant à un manque de diversification ou à une surexposition au risque de défaut d’un même émetteur
Change : quantifier le besoin en capital correspondant à la perte générée par l’effet de change sur la valeur des actifs.

A chacun de ces modules correspond un choc (un ou plusieurs scénarios) qui est appliqué à la fois aux actifs et aux passifs de l’institution (l’assureur/mutuelle) concernée.


  • Transparence accrue

Pour bien évaluer le niveau de capital requis, de nombreuses données doivent être collectées pour être ensuite transmises aux régulateurs. Ainsi, les investisseurs institutionnels type assureurs/mutuelles doivent communiquer périodiquement des vues synthétiques et détaillées de leurs actifs aux régulateurs. Ces vues incluent les noms des émetteurs des actifs qu’elles détiennent, leur notation, la notation du groupe auquel chaque émetteur, …

Chaque OPCVM doit être « transparisé » (i.e. chaque ligne du portefeuille doit être détaillée), sans quoi les fonds seraient alors considérés comme étant placés en actions non cotées, soit le placement qui nécessite de provisionner le plus de fonds propres.

Conséquence : montants nominaux plus importants par ligne de portefeuille, sélection de sociétés de gestion à même de piloter efficacement le SCR de marché et capables de fournir rapidement et de manière fiable les données transparisées.


Sources :

Investisseurs institutionnels : Un secteur en recomposition, Option Finance, mars 2015

Gestion : les institutionnels en quête d’actifs réels, Les Echos, janvier 2016
 
Bouyé Éric, « Allocation stratégique des actifs et gestion de l’investissement à long terme par les investisseurs institutionnels. », Revue d’économie financière 4/2012 (N° 108)

 « 2014 Global Institutional Investor » Survey, Natixis

Af2i, Association française des investisseurs institutionnels

fondsdereserve.fr

http://www.mutualite.fr/actualites/solvabilite-2-transparence-renforcee-pour-la-gestion-dactifs-des-mutuelles

Ukraine, the sick (wo)man of Europe

“A deep, drawn-out recession, triggered by war with Russian-backed forces in the wake of a popular revolt in early 2014, began to subside from mid-2015. At the start of 2016 Ukraine’s « deep and comprehensive » free-trade deal with the EU came into force, but was met with further economic retaliation by the Kremlin. Alongside the emergence of serious domestic political divisions over constitutional and anti-corruption reform, this means that economic recovery may be postponed until 2017.”  – The Economist, Intelligence Unit

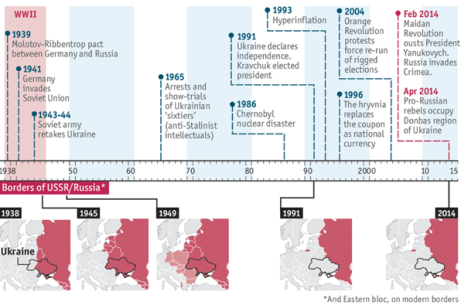
Background: Ukraine’s path 1938-2015

1

Source: The Economist

– Though Ukraine became independent when the Soviet Union collapsed in 1991, it remained largely dependent on Moscow in the ensuing decades.

– The Orange Revolution in 2004 promised new beginnings. But the post-revolutionary government ultimately succumbed to infighting and scandals, paving the way for Viktor Yanukovych, who won the presidency in 2010. Mr Yanukovych’s rampant corruption and his failure to deliver on a promise to bring Ukraine closer to the European Union brought demonstrators to the streets again in late 2013.

– In late 2013, pro-Western protests became the Maidan revolution, which ended with Mr Yanukovych fleeing in February 2014. Russia responded by swiftly annexing Crimea (where it still had a significant naval base) and stoking a separatist war in Ukraine’s east. The ensuing crisis has left thousands dead and displaced millions more.

–>  major cultural divide:  The east and south are primarily Russian-speaking and prone to Soviet nostalgia, tend to favour closer ties with Russia. Ukraine’s west, parts of which belonged to Poland until the second world war, is mostly Ukrainian-speaking and inclined towards integration with the European Union.

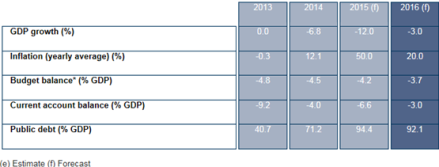
Economic and financial overview

2

Source: Coface, January 2016

3

Monetary policy

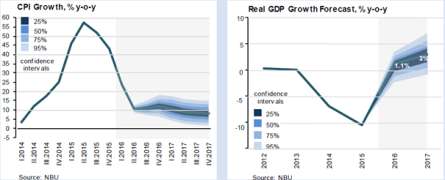
Mandate of the National Bank of Ukraine (NBU): “The priority of monetary policy is defined as the achievement and maintenance of price stability in the country. This Law also defines price stability as retention of the purchasing power of the national currency by maintaining low and stable rates of inflation measured by the Consumer Price Index over the medium term perspective (from 3 to 5 years).”  – BNU

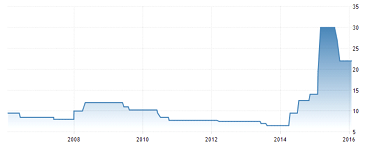
The central bank of Ukraine left its benchmark interest rate on hold at 22 % on 28 January 2016 in order to ensure price stability and achieve the inflation rate target of 12 % by the end of 2016. In the future, provided that the disinflationary trend remains, inflationary expectations improve, primarily due to stabilization of the global commodity markets, the National Bank may resume the gradual easing of monetary policy.

Ukraine Interest Rates

4

Interest Rate in Ukraine averaged 42.21 %from 1992 until 2015, reaching an all time high of 300 % in October of 1994 and a record low of 6.50 % in August of 2013.

–> In the recent period, the NBU has sharply raised interest rates in an effort to curb inflation and prop up its beleaguered currency.

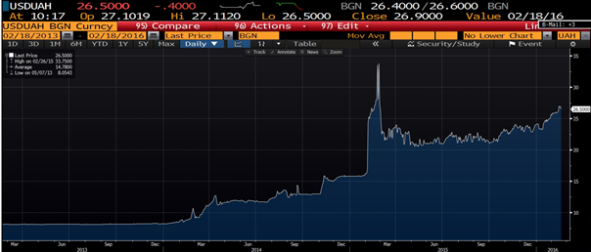
Evolution of the USD vs the Ukrainian currency (hryvnia: UAH)

5

Source: Bloomberg, February 18th 2016

Ukrainian stock market

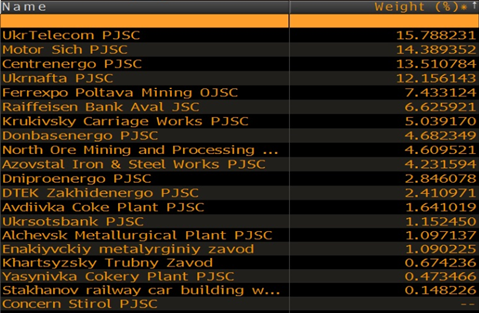
According to the MSCI classification, Ukraine belongs to the MSCI Standalone Market Indexes. The MSCI Ukraine Index was deleted from the MSCI Frontier Markets Index in August 2015 due to liquidity concerns caused by the introduction of capital controls by the NBU on March 3rd 2015.

The biggest stock exchange is the PFTS Stock Exchange, based in Kiev.

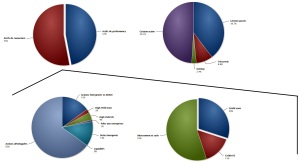
PTFS components and weightings

6

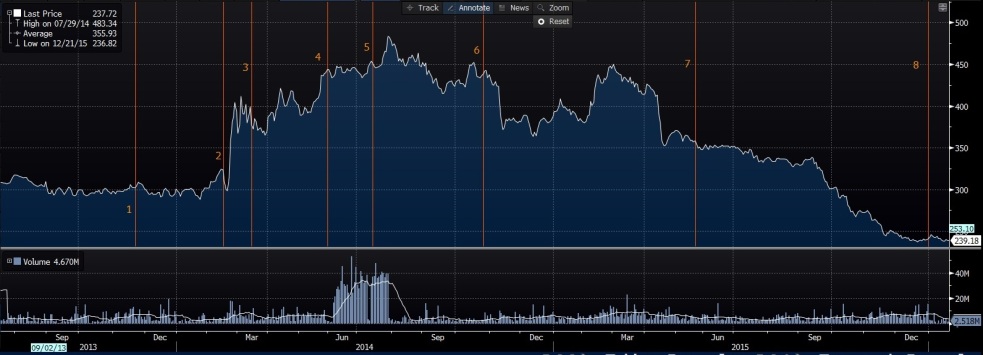
Evolution of the Ukrainian stock market (PTFS Index)

7

1: 21/11/2013: A prolonged crisis in Ukraine began when then-president Viktor Yanukovych suspended preparations for the implementation of an association agreement with the European Union. This decision resulted in mass protests by its proponents, known as the « Euromaidan ».

2: 18/02/2014: Between February 18th and 20th, Kiev fell into violence. 80 fatalities in the capital city.

3: 18/03/2014: Annexation of Crimea by Russia

4: 25/05/2014: Petro Porochenko, former minister, was elected President after the first round of the election

5: 17/07/2014: Malaysia Airlines Flight 17 crashed after being shot down, killing all 283 passengers and 15 crew on board. According to Western intelligence sources, the plane was mistakenly shot down by pro-Russian insurgents using a surface-to-air missile fired from the territory which they controlled

6: 26/10/2014: Pro-European parties win the Ukrainian parliamentary election

7: 22/05/2015: EU provided a EUR 1.8 bn loan to Ukraine

8: 01/01/2016: Entry into force of the Free Trade Agreement between EU and Ukraine

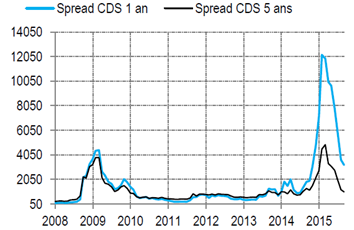
CDS premia Ukraine:

8

This chart clearly illustrates the rising distrust of investors concerning Ukraine’s ability to repay its debt during the Ukrainian crisis. Credit Default Swaps (CDS) are instruments that can be used to insure debt against nonpayment. Ukraine 5-year CDS traded below 500 bp in 2011, meaning it cost less than USD 500 k annually to insure USD 10 M of Ukraine government debt for five years. This spread jumped to more than 4000 bp at the beginning of 2015 – equivalent to a + USD 4 M annual premium.

Risks and opportunities

Over the recent period, Ukraine has been an interesting playground for investors.

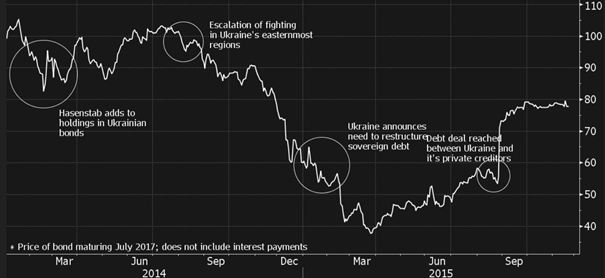
In Ukraine, Franklin Templeton was not very lucky. Fund Manager Michael Hasenstabd, famous for making calls that go against prevailing market sentiment, found himself the country’s biggest investor in 2014, owning about 40% of outstanding bonds at one time. In August 2015, Templeton and three other funds agreed to write off 20% of the value of Ukrainian Eurobonds. It gave Ukrainian Finance Minister Natalie Jaresko the losses she wanted to impose on creditors, but also compensated them with coupon payments and warrants tied to economic growth. Hasenstab is still keen on Ukraine and the experience hasn’t damped his appetite for risky debt.

As we see on the following chart, Ukrainian bonds lost about half their value after Templeton added to holdings.

9

Current Strengths & Weaknesses::

+ Strategic position between Russia and the EU

+ Great agricultural potential

+ Qualified and inexpensive labour

(+ elegant and charming girls)

– High degree of tension with Russia and inter-regional tensions threatening the integrity of the country

– Low economic diversification and dependency on the prices of metals and the price of imported gas

– Excessive borrowing in the private sector and rapid increase in public indebtedness

– Banking system seriously weakened by bad debt and lack of liquidity

Time for risky bets? A country at a vital crossroad

Current political and economic situation (Coface)

  • Political situation

Poroshenko was elected in the first round of the Presidential elections in May 2014, held following the dismissal of V. Yanukovych triggered by the protest movements that erupted at the end of 2013. The two pro-western parties (the Bloc Petro Poroshenko-BPP and People’s Front-NF, party of the Prime Minister A. Yatsenyuk) have a majority of seats in parliament. However, differences within the government coalition, consisting of five pro-European parties, are leading to concerns about its longevity. The BPP won the local elections in October 2015 for which the NF, lacking sufficient public support had not presented any candidate. Social discontent is growing in the face of the significantly worsening economic situation and the overly slow pace of the reforms, particularly those fighting corruption. Prime Minister Arseny Yatseniuk still faces an uphill battle to push through reforms required to secure more money from a $40 billion international aid package. His economy minister resigned at the start of February, complaining that corrupt vested interests were meddling in his ministry’s work. In the east, the Minsk II agreement, signed at the beginning of 2015, helped diminish the intensity of fighting between the Ukrainian army and the pro-Russian separatist movements. The situation remains nonetheless resolutely unstable, overshadowed by the constant fear of a sudden escalation.

  • Economic situation

Industrial activity is expected to remain very limited in 2016, as a result of the loss of the production and export capacities located in the two separatist provinces in the east (Donetsk and Lugansk), where a large percentage of the country’s steel production facilities and coal mines are concentrated. Agricultural production (maize, wheat) could suffer as a result of the drought that hit the country at the end of 2015. In addition, household consumption is likely to remain shackled by the highly restrictive budget policy, rapid inflation and, as with investment, by the prohibitive cost of credit (22% in November 2015). The decline in agricultural production is also likely to limit any increase in exports, which is therefore unlikely to make any positive contribution to GDP in 2016.

Consumer prices are expected to continue rising in 2016, but less strongly than in 2015, as a result of the slowing in energy (gas) price rises and the depreciation of the hryvnia against the dollar. Inflationary dangers remain significant and will thus limit any chances of substantial cuts to interest rates.

An extremely precarious financial situation despite improving public finances

Budget revenues are likely to be held in check by the weakness in economic activity, despite the rise in taxes (tobacco, alcohol, fuel) agreed in the 2016 budget. The government will also have to continue supporting Naftogas, the gas company struggling because of the accumulated arrears owed to its Russian supplier, Gazprom. The severe measures implemented to control spending (lower spending, particularly social and reduced energy subsidies) should, however, help bring the deficit down in 2016. The public debt should remain above 90% of GDP in 2016.

The improvements to the current account deficit should continue in 2016, without any significant recovery in imports. Exports, however, are once again likely to be held in check by the slow growth of production and the prices of leading export products (steel, coal, agricultural raw materials).

Despite the increase in 2015, linked with the IMF aid payment, currency reserves remain low (barely 3 months’ imports) and access to capital markets almost non-existent, for either the State or companies and banks. An agreement signed in October 2015 includes a 20% reduction in the sovereign debt held by private creditors (3.6 billion out of a total of USD 18 billion) and the rescheduling of the balance. The USD 3 billion Eurobond subscribed by Russia late 2013 hasn’t been included in this agreement and Ukraine didn’t pay the bond on due date (December 20). This default on an “official” debt, doesn’t affect IMF aid payments, given the change, agreed mid-December, in rules preventing any IMF support for countries in arrears on official loans. Whereas t its rescheduling proposal (over 3 years without any reduction in the debt) has been rejected by Kiev, Moscow may bring the case to court. Exchange controls, together with a degree of calm in the Eastern regions, allowed the hryvnia to achieve relative stability as of March 2015. Downward pressures are expected to diminish in 2016. However, further depreciation cannot be ruled out, in particular if there is any deterioration in the political situation. It would further increase the public debt (60% denominated in currencies), as well as those of companies and banks, both saddled with large currency debts.

The banking system is extremely fragile and inadequately capitalised, with a level of non-performing loans of around 40%.

–> Ukraine is at vital crossroad, the current political situation is perhaps an ideal for the implementation of reforms.

The need for structural reforms

  • Tax reform

There are 23 taxes and contributions, 18 of which are national and 5 local. The main taxes in Ukraine are the following: Corporate Income Tax (2.7% of GDP); Value-Added Tax (10% of GDP); Personal Income Tax (5.3% of GDP), Single Social tax which is going to social security fund.

–> decrease in the number of taxes, harmonization of tax reporting according to international standards, introduction of the new system of VAT administration.

–> The aim of these planed changes is to increase cost effectiveness of tax administration.

–> Legalization of salary is expected to happen using two ways: reduction of the rate of Single social tax from 41% to 15% + increase of sanctions, including administrative and criminal ones, against “out of pocket” salary payment.

  • Improvement of Economic freedom

According to the 2015 Index of Economic Freedom provided by The Wall Street Journal and The Heritage Foundation, Ukraine’s economy holds the 162nd position in the 2015 Index among 185 countries of the world. A rigid labor market and bureaucratic business regulations inhibit the development of a dynamic private sector.

Priority measures: parliamentary elections, corruption, greater government transparency, reduction of tax burden, improvement of the regulatory environment, judicial reform, simplification of the tax administration.

  • Foreign Trade liberalization and Customs reform

In Trading across Borders in World Bank 2015 Doing Business, Ukraine’s rank is 154 out of 185. The most demanded measures are simplification of customs procedures, straggle against corruption on customs, and reform of customs service itself.

  • Deregulation:

Decrease time on business registration to 2 days, harmonization norms in constructions with EU legislation, decentralizing of construction, deregulation of land usage, fixing property rights problems, harmonized trademarks and licensing issues with international standards. In addition, it is expected to short cut the list of business activities that required licenses. Important issue is change of the system of standards. According Association Agreement with EU, Ukraine will adopted 1500 national standards harmonized with EU ones and repeal standards of former USSR that still in Ukraine.

–> Role of the business and non-governmental actors on setting reform agenda


Sources:

http://us.beyondbullsandbears.com

Bloomberg, Templeton Bond Fund Dodged Disaster Hanging Tough in Ukraine, November 24th 2015

Crisis in Ukraine, The Economist, June 4th 2015

https://www.quandl.com

World Finance Review, May 2015

Coface report on Ukraine


« Forward guidance », entre technique impressionniste et flou artistique

Une « forward guidance » est une déclaration explicite d’une banque centrale concernant la probable trajectoire future de sa politique de taux d’intérêt. Elle est  souvent conditionnée par l’évolution de certains agrégats macroéconomiques.

Jusqu’aux années 1970, le secret entourant les décisions des banques centrales avait souvent pour conséquence de surprendre le marché. Les banques centrales se sont donc orientées vers plus de transparence, et la « forward guidance » participe de cette évolution. Depuis la crise de Lehman et un contexte de faiblesse généralisée des taux d’intérêt, la « guidance » s’est imposée comme outil de communication et est devenue un bras armé de la politique monétaire.

La « forward guidance » dans la théorie économique

En théorie, une « guidance » doit contribuer à rendre plus transparentes et lisibles les politiques monétaires. De cette manière, la banque centrale aide les agents à former des anticipations sur l’évolution future des taux d’intérêt de moyen à long terme – les échéances les plus cruciales des prises de décisions des entreprises et des consommateurs en matière de dépenses.

Les objectifs sont de deux ordres :

– renforcer l’efficacité de la politique monétaire en alignant les anticipations privées sur les projections de la banque centrale, signifiant que la banque centrale lève le voile sur sa fonction de réaction,

– accentuer le degré d’accommodation monétaire : la banque centrale cherche à s’écarter du mode de fixation des taux d’intérêt précédents en maintenant les taux d’intérêt plus bas et pour plus longtemps comparé aux références historiques, afin de soutenir les anticipations inflationnistes, qui pèsent à leur tour sur les taux d’intérêt réels.

Gurkaynak, Sack, et Swanson (2005) montrent que la “surprise” sur les marchés créée par les annonces du FOMC vient moins des changements directs de politique monétaire que de l’effet de signal émis par la Fed au sujet de la politique monétaire future.

L’effet de signal est déterminant. Les travaux de McKay, Nakamura et Steinsson (2015), s’appuyant sur un modèle néo-keynésien vanille, suggèrent par exemple que la promesse par une banque centrale d’un abaissement de 1 bp de son taux directeur dans 5 ans a un effet huit fois plus important sur l’inflation qu’un abaissement immédiat de taux directeur (en raison de la fonction de consommation, régie par l’équation d’Euler).

Exemple de « forward guidance » : la Fed en 2008

Le FOMC, en décembre 2008, introduit une « forward guidance » qualitative en faisant la déclaration suivante : « la morosité de la conjoncture peut justifier des niveaux exceptionnellement bas du taux des fonds fédéraux pendant un certain temps ».

Le FOMC a ensuite fait référence à un intervalle de temps  en indiquant en mars 2009 que sa politique monétaire resterait expansionniste pendant « une période prolongée ». En août 2011, un agenda est même explicité puisque le FOMC précise que le taux des Fed Funds resterait exceptionnellement bas « au moins jusqu’à mi-2013 ».

Des éléments quantitatifs en décembre 2012 : le FOMC prévoit que la fourchette des Fed Funds de 0-0.25% « restera appropriée au moins aussi longtemps que le taux de chômage sera supérieur à 6.5%, que les anticipations d’inflation à 1 an et 2 ans ne dépasseront pas 2.5%, et que les anticipations d’inflation de long terme resteront bien ancrées ».

Ainsi, la « forward guidance » peut se faire plus ou moins précise et se parer d’éléments qualitatifs et/ou quantitatifs, selon l’humeur…

Efficacité d’une « forward guidance »

Les effets de la « forward guidance » sur les taux d’intérêt du marché, puis sur l’économie globalement, dépendent de la crédibilité de la banque centrale.

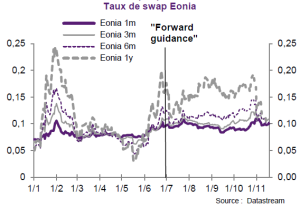
Exemple : en juillet 2013, dans la lignée de la FED, la BCE amorce sa « forward guidance » en annonçant que « le Conseil des Gouverneurs s’attend à ce que les taux d’intérêt directeurs de la BCE demeurent à leurs niveaux actuels ou en-dessous pour une période prolongée » A priori, la « guidance » de la BCE semble avoir pu stabiliser les taux d’intérêt du marché monétaire et signale la relative crédibilité de la BCE à cette période.

fg1

L’orientation fortement haussière des taux de swap Eonia commencée mi-mai s’est nettement retournée après l’annonce de la BCE. Les taux du marché monétaire n’ont toutefois pas retrouvé leurs faibles niveaux de début mai 2013, lorsque la BCE a abaissé son taux refi de 25 bp.

Pour juger l’efficacité de la communication non conventionnelle d’une banque centrale, il faut étudier l’impact des publications conjoncturelles non anticipées sur les taux d’intérêt du marché monétaire. Plus les intervenants du marché seront influencés par la « forward guidance », moins  les annonces conjoncturelles non anticipées auront de conséquence visibles sur le marché.

Difficultés associés à la « forward guidance »

Les risques sont de deux types :

– Perte de crédibilité de l’institution monétaire : si les intervenants de marché interprètent les attentes de la banque centrale en matière de taux directeurs futurs comme un engagement, tout écart par rapport à la politique prévue nuirait à la confiance accordée à la banque centrale.

– Mauvaise allocation des ressources : en communiquant ses projections de taux d’intérêt directeurs futurs, les banques centrales pourraient dans les faits se trouver à l’origine d’une mauvaise allocation des ressources, si leurs prévisions s’avéraient erronées.

L’ambiguïté de la « forward guidance », source de confusion sur les marchés

Les déclarations de Janet Yellen à la suite du FOMC de juin 2015 ont mis en lumière un aspect de la « forward guidance » de la Fed : la dépendance aux données.

“ … the appropriate policy decision is going to be data dependent, and all of us will be looking at incoming data. And our opinions about the appropriate timing of normalization are likely to shift as we look at how the data evolves.”

La “dépendance aux données” est un slogan facile : la quantité de données disponibles est telle qu’on trouvera toujours quelque donnée pour justifier une politique ou une autre.

La clarté des intentions, des objectifs et des moyens d’une banque centrale est source d’efficacité de politique monétaire. Quand la « forward guidance » d’une institution monétaire se résume à une communication vaporeuse, on peut douter de sa crédibilité. En matière monétaire, l’erreur de jugement est peut-être plus pardonnable que le flou des intentions.


Sources :

Focus US, Oddo Securities, n°39-2015 ; Natixis, Special Report n° 187, décembre 2013

The usefulness of forward guidance, Speech by Benoît Cœuré, New York, 26 September 2013

McKay et al., The Power of Forward Guidance Revisited, July 2015

Quels liens établir entre liquidité et volatilité des marchés ?

La liquidité de marché est communément vue comme la « facilité » avec laquelle s’échangent les actifs sous-jacents de ce marché.

Elle peut être mesurée par :

  • la profondeur de marché  (i.e. capacité de réaliser des transactions importantes sans affecter « excessivement » les prix)
  • l’étroitesse du marché (i.e. écart cours acheteur / cours vendeur)
  • la rapidité avec laquelle un ordre peut être exécuté
  • la résilience du marché (i.e. la rapidité avec laquelle les actifs retrouvent un prix « normal » après un choc exogène)

Ainsi, dans la fiction théorique d’un marché parfaitement liquide, les actifs pourraient s’échanger sans coût, sans délai et sans incidence sur les prix.

Parler de volatilité d’un marché, c’est étudier l’importance des fluctuations de valeur des actifs sous-jacents. C’est donc s’intéresser au risque qui leur est associé. Un actif sera donc naturellement considéré volatil si les variations journalières de son prix sont très dispersées autour de sa moyenne. Mathématiquement, la volatilité d’un actif A sur une période T est ainsi l’écart-type de la rentabilité journalière de A sur la durée T.

On peut donc penser que la liquidité d’un marché, en permettant de réduire l’incidence des ordres acheteurs et vendeurs sur les prix, est négativement et significativement corrélée à la volatilité de ce marché. A titre d’exemple, ce postulat (et les observations empiriques qui en découlent) justifie la promotion par l’AMF de la tenue de marché pour les faibles capitalisations boursières.

Au niveau macroéconomique, l’effet de la liquidité sur la volatilité des prix des actifs financiers est plus complexe. La période récente est intéressante en cela qu’elle permet d’observer les effets d’un excès de liquidité (permis par les politiques monétaires expansionnistes de nombre de Banques Centrales) sur les prix, tant sur les actions que pour le crédit.

3 graphiques sont particulièrement intéressants à étudier :

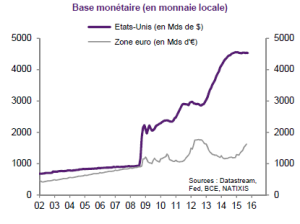
(a) l’évolution de la base monétaire aux Etats-Unis et dans la Zone euro
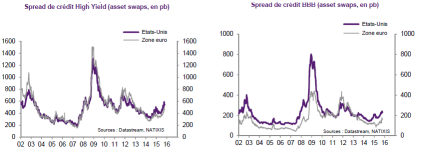
(b) l’évolution des spreads de crédit (HY et IG) aux Etats-Unis et dans la Zone euro
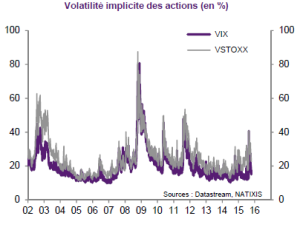
(c) l’évolution de la volatilité implicité des actions aux Etats-Unis et dans la Zone euro

——————————–

(a)

base monetaire

(b)

spreads credit

(c)

volatilite

————————-

On observe en effet deux effets possibles d’une abondance de liquidité :

1) Un excès de liquidité peut permettre une « stabilisation » des cours

– Entre 2010 et 2014 (à l’exception de 2011, avec l’éclatement de la crise des dettes souveraines en Europe) : période de variabilité faible des cours boursiers et des spreads de crédit.

– Explication possible : report des investissements des actifs sans risque (dont les rendements ont été écrasés par les politiques accomodantes des Banques Centrales, comme en témoigne l’évolution des taux à 10 ans sur les emprunts d’Etat aux US et en Allemagne) vers les actifs risqués. Ce report massif fait monter et stabilise le prix de ces actifs.

2) Un excès de liquidité peut accroître la volatilité

– Depuis la fin de 2014, la variabilité des cours boursiers et des spreads de crédit repart à la hausse.

– Explication possible : la liquidité abondante augmente la taille des flux de capitaux qui entrent et sortent des classes d’actifs.

Conclusion

Deux types de régimes paraissent caractériser la relation entre liquidité et volatilité. D’une part, l’abondance de liquidité peut « écraser » la volatilité du marché (2010-2014) ; d’autre part, une même abondance de liquidité peut avoir des effets déstabilisants sur le marché (fin 2014-aujourd’hui).

La variable explicative de ce changement de régime est sans doute le risque perçu par les intervenants du marché. Selon que ce risque augmente ou diminue, la liquidité sera un facteur de stabilisation ou de hausse de variabilité pour les prix des actifs.


Avec Recherche Economique Natixis n°806

Valeurs refuges, asiles précaires

« Dans cette inconstance des choses humaines…. celui-là me semble heureux qui peut avoir un refuge » Bossuet, Sermons, ‘Amour des plaisirs’

Selon Littré, le refuge est ce lieu où l’on s’enfuit pour se trouver en sûreté. Face aux incertitudes des marchés financiers, et – plus encore – en cas de choc systémique, les investisseurs sont tentés de réorienter l’allocation de leurs actifs vers des classes d’actifs considérées comme peu risquées, sures. Après la pluie viendra le beau temps, la phase de risk-on supplantera les accès de pessimisme et l’épargne retrouvera le chemin des marchés actions et autres titres risqués.

De quoi parle-t-on ?

Une valeur refuge doit logiquement voir sa la valeur s’apprécier à mesure que l’aversion au risque grandit. Autrement dit, le prix d’une valeur refuge est négativement corrélé ou non corrélé à celui d’un autre actif (ou portefeuille d’actifs) pendant certaines périodes spécifiques, notamment en période de tensions sur les marchés financiers. Il s’agit pour l’investisseur de se prémunir contre la perte de pouvoir d’achat en investissant dans des certains actifs.

Une valeur refuge n’est pas un « hedge » en cela que la performance d’un hedge est négativement ou nullement corrélée à celle d’un autre actif en moyenne, sans distinction entre période de forte et de faible volatilité.

Que sont ces « refuges » ?

  • l’or, naturellement. Depuis l’âge de pierre, cet actif est lié au pouvoir des Princes. Parmi ses qualités : sa liquidité, sa bonne conservation, sa divisibilité et le fait que la quantité du stock de cet actif ne soit pas à la merci du pouvoir, contrairement aux monnaies.
  • des obligations souveraines émises par des Etats aux fondamentaux jugés solides : bons du Trésor américains (T-bonds pour des maturités >10 ans, Treasury Notes entre 2 et 10 ans), obligations de l’Etat allemand (Bund pour le 10 ans) ou japonais. Allemagne et Japon disposent en effet d’excédents budgétaires et n’ont donc pas besoin de créanciers extérieurs pour financier leur économie. Quant aux US, l’USD constitue une monnaie de réserve internationale, de telle sorte qu’en période de crise cette monnaie sera demandée par de nombreuses banques internationales en manque de liquidités libellées en USD.
  • actifs libellés en francs suisses
  • marché de l’art
  • immobilier dans une moindre mesure

Quelques observations empiriques

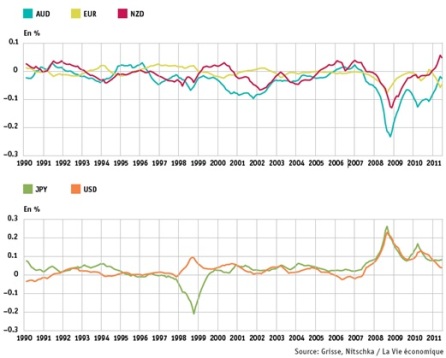
  • L’exemple du franc suisse : prenons le VIX (voir VIX ou l’indice de la peur dans un billet précédent) comme mesure de l’insécurité et de l’aversion au risque. Observons l’effet d’une hausse de 1% de cet indice sur les variations mensuelles nominales du CHF, en %, par rapport à diverses monnaies :


1

Les graphiques supra indiquent que le CHF a été une valeur refuge par rapport à l’EUR pendant la crise financière mondiale et celle des dettes souveraines. Cependant, on note que la hausse du VIX s’est accompagnée d’une valorisation générale encore plus forte de l’USD ou du JPY pendant la crise financière mondiale. La qualité de valeur refuge sde l’or semble donc devoir être appréciée avec prudence, d’autant que la résilience du CHF fluctue dans le temps et selon les chocs. Ainsi durant la crise des dettes souveraines de la zone euro, la progression du VIX s’est traduite par l’appréciation de l’USD et du JPY par rapport au CHF.

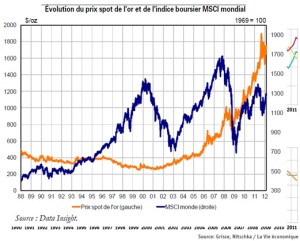
  • L’exemple de l’or pendant la crise de Lehman et celle des dettes souveraines

2

Le cours est passé de 650 $/l’once (oz) en juin 2007 à près de 1 600 $/oz en avril 2012. En comparaison, l’indice MSCI World affiche une baisse de 18 % sur la période.

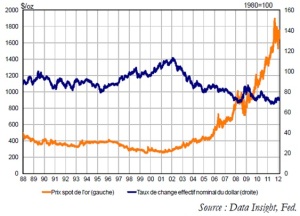
Aussi, le prix de l’or est lié à celui de l’USD, devise dans laquelle il est libellé. En raison de la corrélation négative historique de l’or avec l’USD, l’or fait souvent office d’assurance contre le risque de change pour les investisseurs détenant des actifs libellés en USD.

Evolution du prix spot de l’or et du taux de change effectif nominal de l’USD de 1988 à 2012 :

3

Toutefois, La relation entre le cours de l’or et le dollar n’est cependant pas stable dans le temps : il semble que la corrélation négative entre le cours de l’or et le dollar se soit renforcée depuis (septembre) 2007. faot remremarquable, en période de volatilité extrême, les rendements boursiers et celui de l’or sont positivement corrélés : l’or ne semble alors plus être une valeur-refuge. Ces résultats se retrouvent dans la littérature (Baur et Lucey, 2006), et sont confirmés historiquement par les évolutions observées au T4 2011, au cours duquel l’or a été orienté à la baisse comme les actifs boursiers, dans un contexte de fortes incertitudes sur l’activité économique et la situation des finances publiques. Cette relation positive en période de forte volatilité peut s’expliquer par la nécessité dans laquelle se trouvent les investisseurs de liquider une partie de leurs positions sur l’or pour couvrir leurs pertes sur d’autres classes d’actifs et faire face aux appels de marge.

Sources : La Vie économique, Revue de politique économique, Octobre 2014 et TRÉSOR-ÉCO – n° 101 – Mai 2012